01
Reproducible
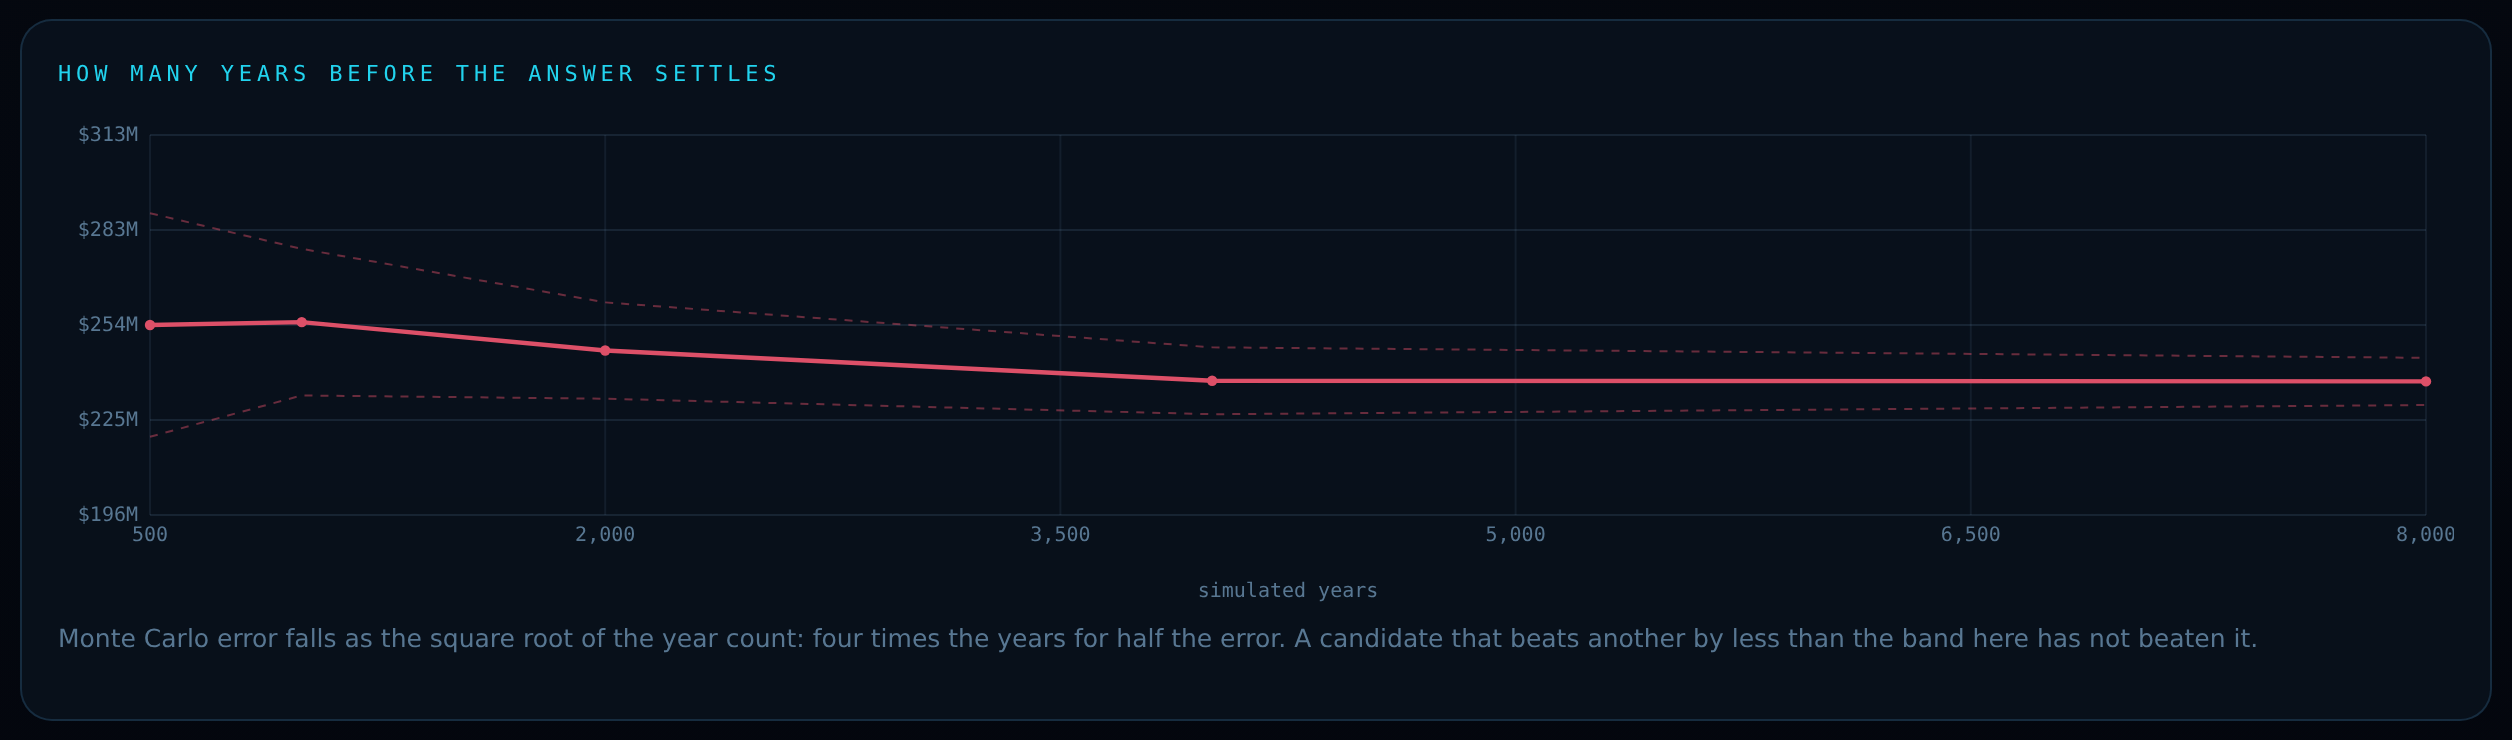
Every simulation runs off a visible, pinned seed. The same seed produces the same result, every time — retype it to replay an identical Monte Carlo. No hidden randomness, no run-to-run drift you can’t control.
Paid analytics is only worth trusting if you can verify it. R-MAP is built so every number is reproducible by construction, your data stays on your own device by default, and the model is honest about what it knows versus what it assumes. This page explains how — and how to check us.

Not a promise — a set of properties built into every instrument and testable by anyone who owns one.
Every simulation runs off a visible, pinned seed. The same seed produces the same result, every time — retype it to replay an identical Monte Carlo. No hidden randomness, no run-to-run drift you can’t control.
The math is re-derived by an independent Python harness, not by the code being tested. The September 7, 2026 pass ran 4,706 checks across 53 instruments (44 web, 9 iOS) with 0 failures; all 85 defects it recorded were fixed. The September 29 pass re-ran all 44 web suites (0 failures) and fixed about 285 further issues, from math to layout and accessibility; a second pass the same day built about 180 improvements, including correlation-aware simulation across the suite, and grew the suites by about 720 checks, again with 0 failures. The October 1 deep check enumerated about 14,000 printed numbers across the 44 web pages, re-derived about 12,600 of them independently, and left the web suites at 6,117 checks with 0 failures. All 38 instruments load and render clean.
Each instrument is a single file that runs on your machine. Bring your own data; it stays on your device unless you choose to save a setup to your account or request a server-side score. No accounts to feed a data lake, no telemetry harvesting your registers, no cloud custody of your numbers.
Where a result is assumed rather than measured, it is labeled as assumed. Sample data is fictional and marked. Instruments inform decisions — they are not financial, legal, or safety advice, and they say so.
The platform layer (KEYSTONE) aggregates across models — so it stamps each measure with its origin and carries that stamp all the way to the board pack. A roll-up is always auditable back to source, and a simulated figure is never silently treated as a measured one.
The industry-realistic demo data every instrument opens with — clearly marked as sample, never mistaken for your reality.
Data you bring or change carries an imported or edited stamp, so a portfolio can be discounted or trusted by origin.
Results the model computes are marked simulated and weighted accordingly — assumptions surfaced, never hidden inside a total.
Mixed units are never summed silently, uncataloged metrics are surfaced rather than dropped, and assumed correlations are labeled assumed, not measured.
The point of building it this way is that a skeptic can verify it in minutes: pin a seed and re-run — the result is identical; read the provenance ledger — every measure names its origin; edit one input — watch it flow through every linked view; export and re-import — the portfolio round-trips through the shared schema unchanged.